Climate Change: Through the Lens of American Communities
Map Visualizations

This map visualizes the location of all of the different community types. You can filter by Community Type and State to get a better idea of where each community type is located.
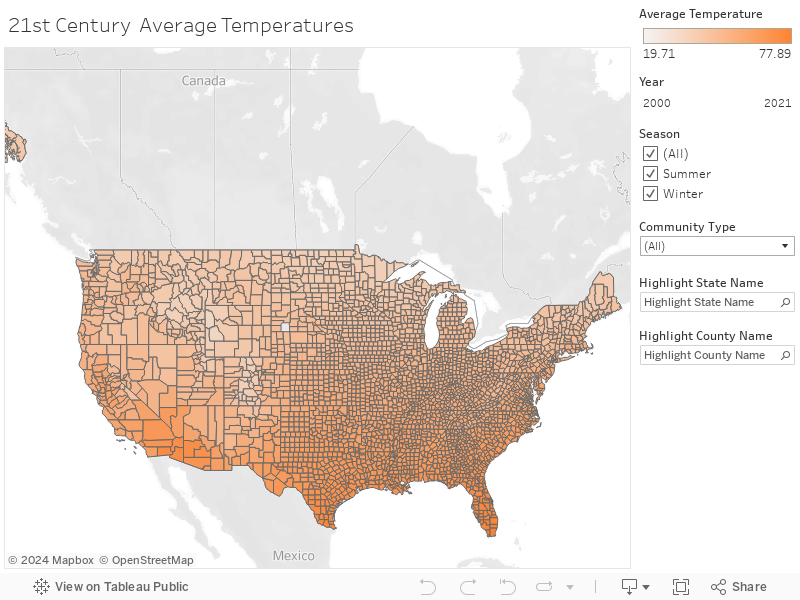
Use this map to better understand the relationship between each community type and average temperatures from the 21st century. You can filter by Community Type, Year, Season, and County.
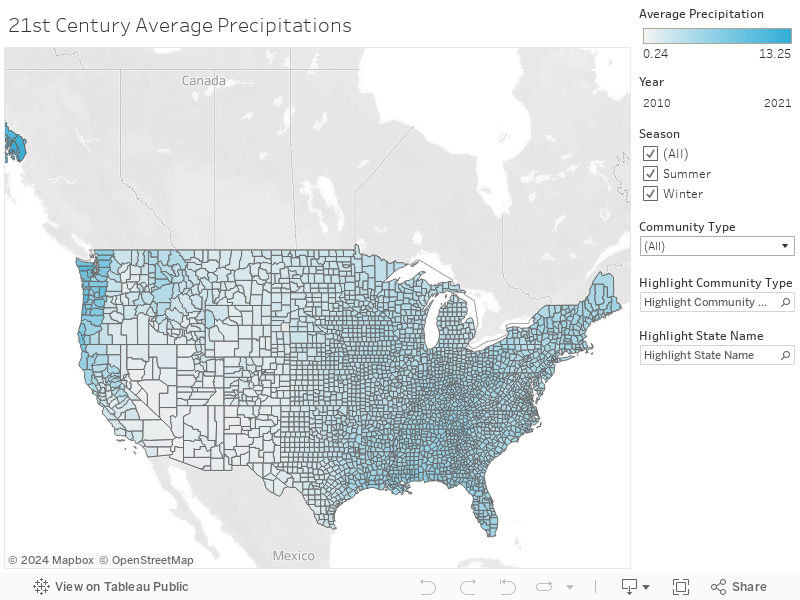
Use this map to better understand the relationship between each community type and average precipitations from the 21st century. You can filter by Community Type, Year, Season, State, and County.
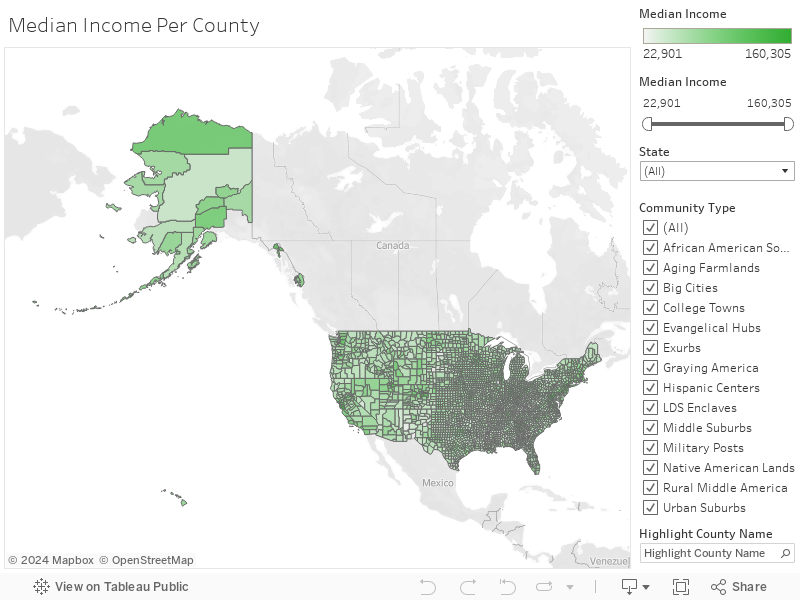
This map visualizes the median income in each county in the USA from the 20th century. You can filter by Median Income, Community Type, County Name, and State.